
Page 86 - Build 165
P. 86
Confusion with perceived water use
The participants were asked to estimate their average household daily water usage. Many participants made estimates based on their water bills, if in a metered area, while others counted how often they used their toilets, and calculated how much water each uses.
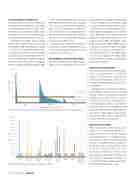
Participants were further asked to classify whether their estimated daily water use was low, medium or high. This information enables us to form some conclusions on how water conscious the respondents are. Most responded as medium water users (see Figure 1). The esti- mates are compared to a summer and winter water use baseline from a previous Auckland Water Use Study undertaken by BRANZ in 2008.
Each column in Figure 1 represents the self-estimated water use for one household – these are categorised into low, medium and high. Some respondents who thought their household water use was high estimated their water use to be both lower than the baselines and respondents that classi ed themselves as medium users.
Similarly, respondents who said their usage was low estimated their daily water use to be greater than respondents that classi ed themselves as medium users.
Water E ciency Labelling Scheme ratings
The Water Efficiency Labelling Scheme (WELS) provides information on a product
such as its water consumption and e ciency to help consumers choose products using less water – similar to the Energy Star ratings.
Respondents were asked whether their tting, xtures and appliances have a WELS rating. Many respondents did not state the rating. This could indicate that many house- holds do not have WELS-rated ttings or that people were unaware of what a WELS rating is.
During a visit to households with high- resolution water meters, participants were asked if they knew what the WELS rating was. Most were unaware of the WELS rating system or did not consider the rating when buying new appliances.
Outdoor water use and climate
As previous New Zealand water-use studies have been largely unable to accurately estimate outdoor water use, this is a focus for this study. It will enable comparisons to be made between districts and, therefore, local climates.
Participants were asked about their garden- watering habits, rainwater tanks, car washing and size of gardens and sections. From this information, there appears to be no correla- tion between section size and frequency of garden watering (see Figure 2). Most partici- pants have sections less than 1,000 m2, and frequency of watering varies signi cantly. For those homes with a high-resolution meter installed, we will be able to quantify this outdoor water use for comparison.
High-resolution metering
High-resolution water meters enable water end uses to be separated. This process requires a visit to households to gather special ngerprints of each tting, xture and appliance, which is then fed through software for detailed analysis (see Figure 3). During the visits, participants were asked about water billing (where present), metering and restrictions. Some partici- pants indicated that their local water bill was too hard to understand and that there is too much information, while some thought the water bills were easy to read.
2,500 2,000 1,500 1,000 500 0
summer average
baseline winter average
12,000 11,000 10,000 9,000 8,000 7,000 6,000 5,000 4,000 3,000 2,000 1,000 0
daily
Figure 2: Frequency of watering gardens compared to section size.
once a week
rarely
never
only in dry weather or as required
Medium Low Perceived water use classi cation
High
Figure 1: Participants’ self-estimate and classi cation of their household water use (columns) against baseline.
84 — April/May 2018 — Build 165
4 times a week
3 times a week
2 times a week
Section size (m2) Litres/day/household
