
Page 79 - Build 165
P. 79
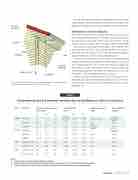
   east and west walls
640 mm
2330 mm
exposed – low
45°
sheltered
boundary
exposed
Overall, the sheltered locations on buildings do not necessarily result in higher material corrosivity. So what factors contribute to the unexpected material degradation pattern in this speci c environment?
Sheltered areas collect more deposits
It is widely accepted that sea salt deposition is the primary factor accelerating material degradation on building envelopes in most New Zealand regions. Speci cally, sheltered areas collect more sea salt particles than exposed areas due to the lack of e cient rain-washing.
The monitoring data found that areas higher on the wall did collect approximately 1.7–3.5 times more salt deposits than lower areas. In particular, the sheltered area on the north wall collected the highest amount, 1.015 g/m2, over the 1-year monitoring period.
The observed positional deposition behaviour was consistent with wind-driven rain monitoring, which showed that higher areas received less rainwater than lower areas on the same wall. For example, the sheltered area on the south wall received no rainwater during the 1-year monitoring period. Meanwhile, the fully exposed area on the north wall received the highest rainwater, 297.8 mm.
Surface deposition and wind-driven rain measurements seem to align with faster material degradation in sheltered areas. However, the material corrosion rates on this building provided a counter argument.
                                                     exposed – high
     Figure 1: Monitoring positions on the building envelope. Only exposed positions at two heights were monitored on east and west walls.
eave
north and south walls
                  Table 1
Environment and performance monitoring on building over the 1-year period
   WALL POSITION
SOUTH Sheltered Boundary
Exposed
Exposed – high Exposed – low
FIRST-YEAR CORROSION RATE (G/M2/YEAR)
SALT DEPOSITION
(G/M2) (MM) a
TIME OF WETNESS (HOURS) b
3,727 4,394 5,195
4,247 4,483
  NORTH
Sheltered
162
147
 69
1.015
0.547
0.166
Not measuredc
3,180
Boundary
156
120
69
0.442
0.251
0.077
94.4
4,442
Exposed
245
 107
65
0.292
0.193
0.053
297.8
4,151
       EAST
Exposed – high
151
153
80
0.471
0.370
0.206
16.4
4,489
Exposed – low
150
128
92
0.285
0.172
0.143
54.2
4,674
WEST
0O 45O
127 112 184 144 220 170
178 166 193 154
90O
33 54 81
80 88
0O 45O
0.700 0.522 0.623 0.407 0.288 0.241
0.469 0.381 0.273 0.198
90O
0.123 0 0.105 19.6 0.085 19.4
0.189 2.6 0.084 14.0
Notes:
a. Rainfall in this 1-year monitoring period was 1,589 mm.
b. The atmosphere surrounding this test building had a time of wetness of 5,339 hours in this monitoring period. c. Extremely limited since rain could only reach this position when the wind was very strong from the north.
WIND-DRIVEN RAIN
Build 165 — April/May 2018 — 77
