
Page 83 - Build 165
P. 83
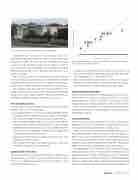
                                        Figure 2: Building damage following the West Coast windstorm.
Simulations were run for two recent extreme events – the Canterbury windstorm of 2013 (see Figure 1) and the West Coast windstorm of 2014. These storms caused widespread damage to houses, roads, powerlines and forests (see Figure 2). Insured losses were put at over $120 million. In Canterbury, more than 800 agricultural irrigators were damaged, and many were out of action for months.
The comparison has shown good agreement between the full-scale measured wind speeds and the wind speeds predicted by the NZCSM computer model for these two events (see Figure 3). This suggests that the model could be applied more widely across New Zealand.
The comparison also showed that more damage and more severe damage usually occurred in areas where the model predicted higher winds speeds. This suggests that the simulation model has the potential to identify areas where wind damage may occur.
Post-storm damage surveys
In Greymouth, post-storm building damage surveys were undertaken by NIWA. These surveys showed that:
● more signi cant damage occurred to residential buildings (mostly
unengineered) than commercial (sometimes engineered) buildings
● older houses (pre-1970) fared worse than more modern houses
● 90% of damaged buildings su ered roof damage, 20% su ered
wall damage, 26% su ered damage to windows or other openings
● windblown debris (tree branches, loose items, building elements) was often a cause or signi cant contributor to the damage, with
broken windows allowing water entry
● many houses su ered damage to gutters and fascia boards, again
allowing potential water entry
● water damage often followed the initial damage due to wind, with
over 40% of damaged houses being a ected.
Applying model to other areas
The agreement between the full-scale data and the computer model has given us the con dence to move forward with another part of the project – applying the computer model to the whole of New Zealand. The intentions are to:
60
40
20
00 20 40 60 Measured gust speed (m/s)
Figure 3: Comparison of measured and predicted wind speeds in the Canterbury 2013 and West Coast 2014 windstorms.
● compare the predicted wind speeds with the design wind speed maps contained in the wind loading standard AS/NZS 1170.2:2011 Structural design actions – Part 2: Wind actions
● improve the design wind speed maps to provide greater spatial de nition and clarity with a Google Earth-style presentation, particularly in the lee zones downwind of the main ranges.
Detailed information hard to  nd
Trying to gather information on wind damage has shown us that, despite the levels of damage, the known insured costs and the unquanti ed costs, detailed information is very hard to come by. Typically, insurance company emphasis is on the overall cost value.
However, after large numbers of expensive farm irrigators were damaged, there has been some investigation of damage avoidance and mitigation options.
Lessons to be learned
Regional and local councils, emergency services, power and telecom- munications providers and civil defence organisations mostly focus on ensuring safety and getting services working again.
Much less e ort is devoted to understanding what lessons can be learned and how these could be applied to reduce the impacts of future events. Some responsibility must rest with individual home- owners and their maintenance practices. Improving education and regulation, such as the Electricity (Hazards from Trees) Regulations 2003, has the potential to signi cantly reduce future damage.
The Wind Engineering Consortium is also currently involved in developing objectives for one of the government’s 11 National Science Challenges, Resilience to Nature’s Challenges. We intend to examine the impact of an intense tropical cyclone passing over Auckland city during the day to identify vulnerabilities with existing infrastructure and services so appropriate ameliorative measures can be put in place.
 Build 165 — April/May 2018 — 81
NZCSM predicted speed (m/s)
