
Page 55 - Build 165
P. 55
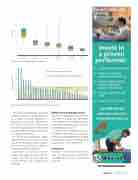
    30 25 20 15 10
5 0
Figure 1: Houses have become more airtight over time.
1.2
1.0 0.8 0.6 0.4 0.2
0
Figure 2: Average ventilation rate and estimated in ltration rate in houses.
Medium-density housing
                                    Pre-1960
1960–69 1970–79
1980–89 1990–99
2000’s
   Measured average ventilation rate
Estimated in ltration rate from blower door test
recommended range
               Houses
 Both of these buildings have dedicated ventilation systems, so the apartments are not as reliant on natural ventilation as a typical stand-alone house. Although it is not a key part of the project, we have  ow hoods that could measure the delivered  ow from the ventilation system as part of our test equipment if required.
To conduct the measurements, BRANZ sta  visited each site for a total of 2–3 days testing. The ideal time to do the testing is post-construction but pre-occupation, because this minimises disruption.
In the Otago case, however, construc- tion was still ongoing. Because of this, we couldn’t do the full inter-unit testing, but we were still able to get useful data from many units.
Bene ts to you from being involved
The bene t of taking part in the project for a developer or designer is the information on the airtightness of your building. You will be provided with all the data we collect on that building if you want it.
Unless you have an airtightness target or speci cation, the testing is not a pass-fail, but it can certainly highlight where the likely leakage paths are. These could then be given extra attention on your next project.
Get involved
To volunteer your project or to find out more about the research, email build- [email protected] and we will get in touch!
 Build 165 — April/May 2018 — 53
FEATURE SECTION
ach @ operating pressure ach @ 50 Pa
