
Page 85 - Build 161
P. 85
No nancial drivers outside Auckland
The nancial feasibility of rainwater and grey- water systems is almost entirely dependent on regional volumetric water and wastewater tari s.
The case study buildings showed that, despite having poor nancial payback periods in their own regions, using an Auckland-based tari structure meant they became nancially feasible. This is also demonstrated in the tari impact of water use and e ciency in previous New Zealand studies.
Currently, outside of Auckland, the charging mechanisms (volumetric wastewater tari s)
100% 90% 80% 70% 60% 50% 40%
30%
20%
10%
Mains
Mains
Mains
Mains
Mains
Mains
Mains
Rain
Rain
Rain
Rain
Rain
Rain
Rain
Mains
Grey
do not provide nancial drivers for buildings 0%
Rain
to use less water or become less reliant on the mains-reticulated networks.
Other bene ts should be quanti ed
Non- nancial or intangible bene ts have not been quantified in this study. Other secondary, indirect or non- nancial bene ts should be further quanti ed to present the full value case. These include:
● individualresilienceduringpost-disaster fault to water network
● reductioninchemicaltreatmentofwaste entering the wastewater network
● potentially delayed infrastructure requirements by reduction in mains potable water and wastewater quantities.
Impact on water networks varies by region
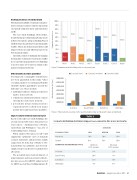
Based on the eight case study buildings, the average non-potable water demand across four regions – Auckland, Bay of Plenty, Canterbury and Wellington – was 23% of total building water demand.
When analysed by region, not all could supply this ‘optimistic’ (23% of demand) scenario. Rainwater and greywater supply ranges from 4% in the Bay of Plenty to 38% in Canterbury. An ‘optimistic’ and ‘observed’ supply scenario was therefore calculated for all regions.
The potential water network impact of using rainwater and/or greywater technolo- gies was assessed for 2015/16 and projected for 2066 based on three building uptake
BoP 1
Akld 1
Figure 1: Proportion of total building water use, by water type.
7,000,000 6,000,000 5,000,000 4,000,000 3,000,000 2,000,000 1,000,000
-
Akld 2
Akld 5
Canty 1
Scenario 2 (medium)
Canty 2
Canty 3
Wgtn 1
Scenario 1 (low)
Scenario 3 (high)
Auckland
Figure 2: Projected annual savings to the water networks under an 'observed' supply and demand.
Table 1
Scenario definition for future impact assessment to the water networks
BUILDING UPTAKE
SCENARIOS
LOW MEDIUM HIGH
Bay of Plenty
Canterbury
Wellington
New build
10%
20%
30%
Retrofit
0%
10%
20%
RAINWATER AND GREYWATER SUPPLY
Optimistic Observed (23% average) (19% average)
Auckland
14%
25%
Bay of Plenty
28%
4%
Canterbury
42%
38%
Wellington
9%
9%
Build 161 — August/September 2017 — 83
Volume of water (kL/year) Proportion of water use
